Monitoring the right things in your network and making them visible in dashboards can make the difference between proactive and reactive responses to network problems. I recently wrote about
using log data in network management, and now it’s time to talk about how to handle network performance data.
What to Monitor
Network monitoring systems must collect the data necessary to detect problems and diagnose failures. Pay attention to the following data:
- Interface state changes (up/down),
- Errors
- Dropped packets
- Capacity utilization
- Device memory
- CPU utilization
In addition to the above, collect data about routing and switching protocols and neighbors. This is beneficial for diagnosing packet forwarding problems. It is best to collect this data on a one-minute or five-minute basis. This helps catch problems before they scale up. Less frequent collection
can hide significant events. As I wrote last year, “We frequently have difficulty conceptualizing how problems scale up as our IT systems grow. Events that are supposed to be extremely rare are occurring more frequently than our minds would otherwise indicate.”
A digital experience monitoring platform’s automated test results is another valuable data source. Correlating and reporting of this data drives proactive detection of network problems.
Collecting the Data
There has been a push recently to transition from SNMP’s “pull” model of data collection to telemetry’s “push” model. But they aren’t the only sources of data. There are also the command line interface, Windows management interface, and APIs, to name a few. The reality is that the data collection method doesn’t make a significant difference. The objective is to get the data and store it in a format that makes it useful for analysis.
Data Storage
Network monitoring relies on multiple types of data. Some data is highly relational and is best stored in a relational database. Examples of this relational data include: device types, operating system version, hardware inventory, location, and technical contact. However, performance data is tied to the time it was collected and is best stored in a time-series database.
Matching the data type with its corresponding database type provides the best performing network monitoring system (NMS) platform. Systems that attempt to store performance data in a relational database typically need a large platform architecture with multiple collectors and these systems have a correspondingly high cost of implementation and management. One of the reasons that relational databases don’t work well for performance data is that the database is optimized for reading by maintaining indexes. Updating the table indexes when writing the performance data into the relational database makes it significantly slower than writing the same data to a time-series database.
Performance Monitoring Dashboards
The network management system needs to turn the collected data into actionable information. This is where many systems are deficient. There might be flashy graphics with pie charts and bar charts that show how well parts of the network are performing. But what’s needed are displays of the network elements that need attention, like interfaces with high errors/drops, high utilization, or nearly full stateful firewall tables.
How do you identify the most problematic statistics? One of the most useful methods is through a “Top-10” report that shows the top ten elements, sorted by either percentage or count. Note that packet loss percentage thresholds should be on the order of 0.0001% of total packets to identify interfaces that are impacting TCP performance. Utilization figures should be based on the 95th percentile calculation as noted in the article on the
hazards of average network statistics.
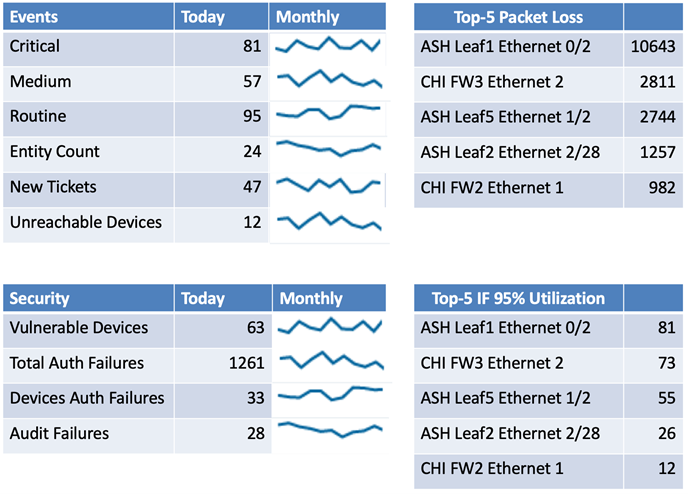
Displaying all those statistics in a concise dashboard is quite a challenge and that’s where most network management platforms fail. Some displays need both the current value and a historical graph so that you can determine the trend. Here’s a concise mock-up of an information-packed dashboard. It takes advantage of Top-5 lists and shows separating network and security events into different categories. A more complete dashboard would include additional statistics.
Additional network management data sources, such as alerts from digital experience monitoring can be incorporated by using APIs to collect the data.
Scaling Issues
Networks with more than a few thousand interfaces will start to encounter scaling issues. The main factor is the number of interfaces that must be monitored. It is typical for most mid-scale network equipment to average about fifty network interfaces. Networks that use a significant number of virtual interfaces may have a higher average. Multiply the average interface figure by the number of devices to arrive at an approximate number of managed elements. That’s the figure that most vendors will need to size a network management system (and its price).
Collecting the data, storing, analyzing, and displaying the results all have an impact on the size of the management system. Many network management systems address the scale by rolling up the data on a periodic basis. The typical process averages the raw daily performance data into hourly data every day. The resulting loss of high-fidelity data makes it impossible to perform detailed historic analysis.
The user interface presents another scaling issue. How does the system display the data collected from hundreds or thousands of devices and interfaces? That’s where the user interface must provide easy-to-use display filtering and concise reports that highlight actionable information.
Summary
Network monitoring is a typical big data business application. Large volumes of data contain clues to network performance problems. Applying the right techniques can help you identify the problems so that you can improve the network’s operation.


